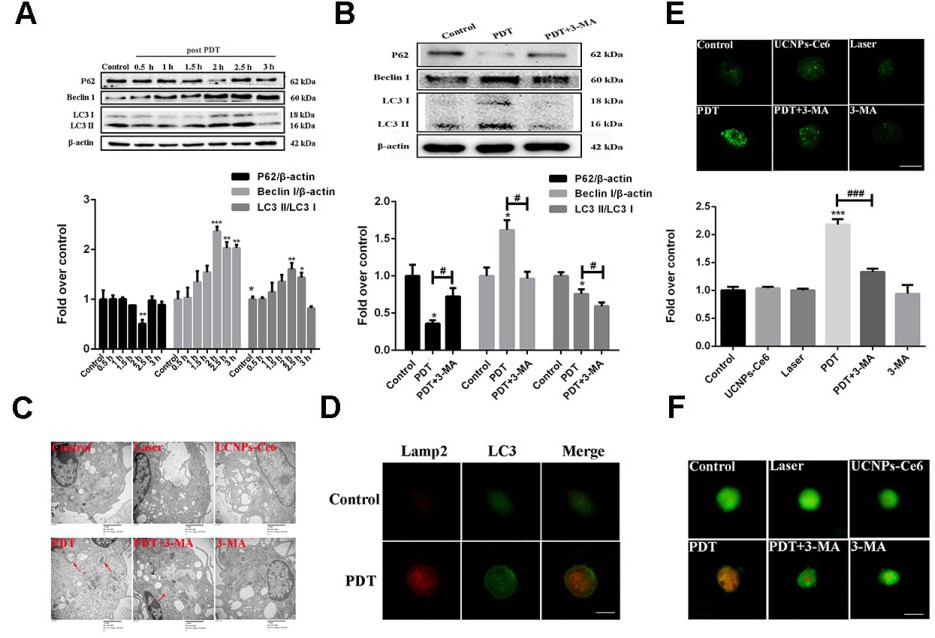
Fig. 4. PDT induced autophagy in M1 peritoneal macrophages. (A) The expression levels of the p62, Beclin1, and LC3 II/LC3 I at different treatment times after PDT (n = 3). (B) The effects of 3-MA on the expression of p62, Beclin1, and LC3II/LC3I (n = 3). (C) Morphological changes of M1 peritoneal macrophages were observed using transmission electron microscopy. Red arrows indicate the autophagosomes (scale bar: 2 μm). (D) LC3 and Lamp2 co-localization at 2 h after PDT using LSCM (scale bar: 5 μm). (E) Autophagic vacuoles induced by various treatments using MDC staining (scale bar: 5 μm). (F) Autophagic vacuoles induced by various treatments using acridine orange staining (scale bar: 50 μm). * P<0.05, ** P<0.01, *** P<0.001vs control group, # P<0.05 vs PDT group.